The international scientific and analytical, reviewed, printing and electronic journal of Paata Gugushvili Institute of Economics of Ivane Javakhishvili Tbilisi State University
ECONOMIC RELATIONS BETWEEN GEORGIA AND BULGARIA: CURRENT STATE AND PROSPECTS
Summary
Currently progressive steps are being taken to develop Georgia-EU economic cooperation. A new Association Agenda for 2017-2020 has officially entered into force [Association Agenda, 2017], which enables Georgia to ensure the highest possible degree of approximation with EU standards and norms by 2020. The EU confirms its willingness to continue its eastern enlargement, while Georgia has an ambition to further expand its regional economic cooperation and ultimately become a member [Grigalashvili, p. 2, 2017]. At the Eastern Partnership Summit 2017, it was clearly stressed that the support by the EU for bilateral relations among the partners is very important, so that partner countries get real gains from the DCFTA [Eastern Partnership - 20 Deliverables for 2020, p. 20, 2017]. Considering the above political orientation, the study of the opportunities and the foundations of economic cooperation with EU countries is paramount because the success and achievements in institutional cooperation have not been adequately translated into the economic gains. Evaluation of the depth of bilateral economic cooperation is a precondition for the appropriate political decision-making. Considering the context above, the present article is devoted to the issues of Georgia’s cooperation with Bulgaria. The topic is noteworthy because Georgia has not reached so large trade with any of the EU country, as it has with Bulgaria. The goal of the research is to study different areas of economic cooperation and evaluate their prospects of further development between Georgia and Bulgaria. To this end we set the following tasks: to present the general economic background indicators of both countries; to evaluate the dynamics of bilateral exports, imports, trade balance and product structure of the bilateral trade relations; to outline the main trends in the bilateral foreign direct investment flows; to present the recent developments in the other forms of foreign economic relations (tourism, money transfers and energy cooperation) between the two countries. Based on the research the paper gives the systemic evaluation of the depth of economic cooperation and provides recommendations on the future development of Georgian-Bulgarian economic ties.
Keywords: Georgia, Bulgaria, Georgian-Bulgarian economic relations
JEL Codes: F13, F15, F21, F24, F29.
Introduction
In 2017 Georgia and Bulgaria mark 25 years of the establishment of bilateral diplomatic relations. Throughout this quarter century the political, cultural, trade and economic relations have been developing on an upward trend without however reaching their full potential due to various external reasons. Historically those two nations have had friendly and dynamic ties based on their geographical proximity being situated on the west and east sides of the Black sea and their cultural and religious similarity based on common Orthodox faith.
After the collapse of the Eastern bloc Bulgaria has been faster in its strategy to return to Europe. It has already passed through the way of EU (2007) and NATO (2004) accession that Georgia considers as the top foreign policy orientation priority and is striving at now. Georgia is now a partner country of the Eastern Partnership within the European Neighborhood Policy. Bulgaria has been actively supporting the integration efforts of Georgia and is committed to share its experience with the European and Euro-Atlantic path. The Georgian embassy in Sofia is assigned as a contact point for communication with NATO and Bulgaria will take over the Presidency of the EU in the first half of 2018 with the main priority the European perspective of the Western Balkans and the Eastern Partnership – that creates prerequisites for further boost of the bilateral dialogue and cooperation. Both countries are members of the Black Sea Economic Cooperation Organization.
For the last decade Bulgaria has been among the top 10 export markets for Georgia and also the biggest export destination within the EU as it is the closest geographically situated EU Member State. A significant stimulus for the bilateral trade and economic relations is expected by the EU-Georgia Association Agreement that entered into force in July 2016 and aims at political association and economic integration between the EU and Georgia. The agreement introduces a preferential trade regime – the Deep and Comprehensive Free Trade Area (DCFTA), provisionally applied since September 2014 that removes all import duties on goods and provides for broad mutual access to trade in services. It allows the EU and Georgian companies to set up a subsidiary or a branch office on a non-discriminatory basis. Furthermore, visa liberalization for short stays in the EU of Georgian citizens entered into force on March 28, 2017 [EU External Action, 2017].
Besides the EU integration developments another impetus for the Bulgarian-Georgian bilateral foreign economic relations in the coming years might come from another major player in the global economy. The “One Belt and One Road” initiative unveiled by China in 2013 will encompass land routes (the “Belt”) and maritime routes (the “Road”) with the goal of improving trade relationships in Central Asia, the Middle East and Europe primarily through infrastructure investments. Sixty-two countries (among which Georgia and Bulgaria) could see investments of up to US$500 billion over the next five years mostly in transportation and energy projects [Bruce-Lockhart, A., 2017].
Approximation with the EU is impossible without expanding bilateral economic cooperation with separate EU countries. Therefore, the analysis of the achieved level of development of economic linkages in order to open potential areas of cooperation is very important, especially with relatively new EU member countries. Bulgaria is geographically close to Georgia and there are similarities in the economic structure and development levels of the two countries. Bulgaria can be a certain channel to reach the markets of more developed members of the EU. In this regard, the study of cluster development potential and making appropriate recommendations for the government and the firms can bring tangible positive outcomes.
The present paper analyzes current state of bilateral economic relations between Georgia and Bulgaria in order to reveal the areas, where existing potential is not fully used. Considering the above the major research goal of the paper is to study different areas of economic cooperation and evaluate their prospects of further development between Georgia and Bulgaria. To this end we set the following tasks: to present the general economic background indicators of both countries; to evaluate the dynamics of bilateral exports, imports, trade balance and product structure of the bilateral trade relations; to outline the main trends in the bilateral foreign direct investment flows; to present the recent developments in the other forms of foreign economic relations between the two countries and to come up with conclusion about the future prospects of Georgian-Bulgarian economic ties.
Bulgaria has an open economy that historically has demonstrated strong growth, but its per capita income remains one of the lowest among EU members. Its reliance on energy imports and foreign demand for its exports makes its growth sensitive to external market conditions.
From 2000 through 2008, Bulgaria maintained robust, average annual real GDP growth at above 6%, which was followed by a deep recession in 2009 as a result of the global financial crisis. It caused domestic demand, exports, capital inflows and industrial production to contract, prompting the government to reduce spending. Until 2015 the real GDP growth remained slow at less than 2% annually. Later on, the demand from EU countries for Bulgarian exports, plus an inflow of EU development funds, boosted growth to more than 3%. In recent years, low international energy prices have contributed to Bulgaria’s economic growth and helped to ease inflation as well. According to the forecasts of the European Commission, Unemployment is projected to continue falling, while wages grow strongly. Thus, the general macroeconomic framework is favourable, the government budget is expected to remain balanced and slowly turn into surplus, despite increases in public investment and public wages.
As for the economy of Georgia, over the past decade it has grown at an average annual rate of 5%. It had the GDP growth of more than 10% in 2006-07, based on strong inflows of foreign investment and robust government spending. However, the GDP growth slowed as a result of numerous shocks, including the global financial crisis of 2008–09, the conflict with Russia in 2008, and the regional economic and political volatilities in 2014. The economy revived in 2010-16, but FDI inflows, the engine of Georgian economic growth prior to the 2008 conflict, have not recovered fully. Unemployment has also remained high. The country continues making efforts for renewed growth relying on the liberalization of the economy by reducing regulation, taxes, and corruption in order to attract foreign investment, with a focus on hydropower, agriculture and tourism.
Table 1
Selected Economic Indicators of Georgia and Bulgaria, 2015-2016
|
Indicator |
Georgia |
Bulgaria |
|
GDP (current $) |
37,181.60 |
136, 847.56 |
|
GDP per capita growth (annual %) |
2.7 |
4.2 |
|
GDP Annual Growth (%) |
2.7 |
3.4 |
|
Government Debt to GDP (%) |
41.3 |
30.3 |
|
Government revenue (excluding grants) to GDP (%) |
24.7 |
27.2 |
|
Government expenditure to GDP (%) |
25.6 |
27.8 |
|
Unemployment rate (% of total labor force) |
11.6 |
8.0 |
|
Inflation, consumer prices (annual %) |
2.1 |
-0.8 |
Source: World Development Indicators, 2016
Bilateral Trade Relations of Georgia and Bulgaria
Georgia has been engaged in trade with Bulgaria since the early years of independence, but significant changes in bilateral exports and imports have taken place since 2003. The share of Bulgaria in Georgia’s total exports has varied around 0-10% and peaked in 2015, while the share of imports was between 2-6 % (figure 1) The value of exports reached its maximum in 2015 due to seven-fold increase in the value of crude oil and in its products compared to the previous year ( HS 270900).
Figure 1

Source: The figure is based on data obtained from the National Statistics Office of Georgia http://www.geostat.ge/
The total trade turnover between Georgia and Bulgaria boosted in 2008 followed by a slump (this was the case in many countries after the global economic crisis). There was trade improvement and increase in trade flows in 2014, followed again by falling in trade turnover. Despite Bulgaria’s importance as a trade partner (considering its share in Georgia’s exports), import from Bulgaria mostly exceeds exports and therefore Georgia’s trade balance in constantly negative, shown on figure 2.
Figure 2
Georgia's Trade with Bulgaria, 1995-2016 (Thousands of dollars)
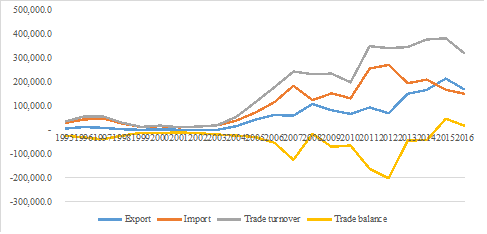
Source: The figure is based on the data obtained from the National Statistics Office of Georgia http://www.geostat.ge/
Despite the fact that the share of Bulgaria in total exports and imports of Georgia is small, it is Georgia's largest trading EU partner (Table 2). The analysis of Georgia’s export and import with EU countries presented on the table 2 shows that among the EU countries Bulgaria is the largest export destination, while on average it takes fourth position by imports. Noteworthy to mention, that Georgia has not reached so large trade turnover with any of the EU countries, as it has with Bulgaria and Bulgaria is among those rare cases, where Georgia’s trade balance became active (in 2015 and 2016).
Table 2
|
Georgia’s Largest Export and Import Partners in the EU, %, 2010-2016 |
|||||||
|
Export |
|||||||
|
|
2010 |
2011 |
2012 |
2013 |
2014 |
2015 |
2016 |
|
Bulgaria |
21.6 |
22.1 |
19.7 |
24.8 |
26.8 |
33.2 |
29.3 |
|
Germany |
11.3 |
11.6 |
10.9 |
12.1 |
11.1 |
11.7 |
14.9 |
|
Italy |
8.4 |
17.8 |
15.1 |
13.4 |
13.8 |
11.6 |
12.7 |
|
Import |
|||||||
|
Bulgaria |
9.0 |
12.4 |
11.1 |
8.6 |
8.8 |
8.1 |
6.8 |
|
Germany |
22.8 |
23.4 |
22.2 |
19.8 |
19.7 |
20.7 |
19.0 |
|
Italy |
9.3 |
9.0 |
11.2 |
9.7 |
9.4 |
9.5 |
11.9 |
|
Romania |
9.6 |
9.1 |
10.7 |
14.3 |
13.2 |
10.0 |
8.6 |
Source: Authors’ calculations based on the data of the National Statistics Service of Georgia, www. geostat.ge
The figure below shows the dynamics of Georgia’s export to Bulgaria, which has been increasing since 2003.
Figure 3

Source: The figure is based on the data obtained from the National Statistics Office of Georgia, http://www.geostat.ge/
The export flows from Georgia are non-diversified (by 6 digit categories of the HS 35 commodity groups has been exported up to present). Since 2010 relatively stable commodity groups in the export have been: sulphur ores and its concentrates HS 260300; ammonium nitrate, whether or not in aqueous solution HS 310230; hazelnuts or filberts (corylus spp.), fresh or dried, shelled HS 080222; Copper; waste and scrap HS 740400; ferro-silico-manganese HS 720230; Iron or steel (excluding cast iron or stainless steel), seamless, line pipe of a kind used for oil or gas pipelines HS 730419; waters; mineral and aerated, HS 220110; Wine; still, in containers holding 2 litres or less HS 220421. A stable but small export category is medicaments HS 300490. A small commodity group in exports are also automobiles of various types.
The export of the following commodity categories were fragmentary: vegetable products HS 070999 (in 2005-2016); Ceramic statuettes and other ornamental ceramic articles, other than of porcelain 691390 (in 2012-16); Plastics; household articles and hygienic or toilet articles HS 392490 (2016-17), etc. According to the information obtained from Kasta Ltd, some steps have been taken towards the development of furniture cluster. There was 2154.8 thousand dollar export to Bulgaria of furniture related commodity category, namely fittings for furniture, coachwork or the like HS 392630.
Table 3
Georgia’s Export to Bulgaria, by the largest export categories, 2010-2016, (Thousands of dollars)
|
Commodity |
2010 |
2011 |
2012 |
2013 |
2014 |
2015 |
2016 |
2017 (January-September) |
|
Sulphur ores and its concentrates |
54,492.0 |
76,970.5 |
48,617.1 |
117,146.0 |
142,735.4 |
137,427.3 |
141,188.1 |
106,289.2 |
|
Ammonium nitrate, whether or not in aqueous solution |
11,053.0 |
15,792.5 |
18,424.8 |
31,890.6 |
10,222.4 |
12,651.1 |
14,575.7 |
12,382.1 |
|
Hazelnuts or filberts (Corylus spp.) |
112.5 |
133.4 |
162.6 |
145.6 |
4,242.0 |
467.5 |
232.4 |
58.2 |
|
Copper; waste and scrap |
- |
- |
1,111.7 |
133.4 |
121.5 |
938.9 |
597.8 |
1,977.6 |
|
Ferro-silico-manganese |
- |
- |
- |
360.3 |
376.5 |
70.6 |
1,106.1 |
862.1 |
|
Waters; mineral and aerated |
10.8 |
23.6 |
43.0 |
72.5 |
100.5 |
77.5 |
45.6 |
87.4 |
|
Wine; still, in containers holding 2 litres or less |
44.3 |
43.3 |
41.8 |
17.2 |
7.1 |
26.0 |
35.7 |
50.5 |
Source: The table is based on the data obtained from the National Statistics Office of Georgia http://www.geostat.ge/
Similar to exports, substantial increase in import from Bulgaria has taken place since 2003 (figure 4). There was a sharp fall in import in 2009. It reached its peak in 2014 for the first time after 1995.
Figure 4
Georgia’s Import from Bulgaria, 1995-2016 (Thousands of dollars)

Source: The figure is based on the data obtained from National Statistical Office of Georgia http://www.geostat.ge/
Import from Bulgaria is composed of approximately 100 commodities according to the 6 digit categories of the Harmonised System. The analysis of the product groups that have been imported from Bulgaria since 2010 up to the present (table 4) shows that more than 1 percentage share is taken by the following commodity groups: light distillates and products; petroleum oils and oils from bituminous minerals, not containing biodiesel, HS 271012; Petroleum oils and oils from bituminous minerals, not containing biodiesel, not crude, not waste oils; preparations n.e.c, containing by weight 70% or more of petroleum oils or oils from bituminous minerals; not light oils and preparations HS 271019; medicaments; consisting of mixed or unmixed products HS 300490; games; operated by coins, banknotes, bank cards, tokens or by other means of payment, other than billiard articles HS 950430; cigarettes; containing tobacco HS 240220; cash registers HS 847050; hair preparations HS 330590; presses, crushers and similar machinery; used in the manufacture of wine, cider, fruit juices or similar beverages HS 843510; carbonates; disodium carbonate HS 283620; washing and cleaning preparations; surface-active, whether or not containing soap HS 340220.
Among these import categories the largest share is taken by: petroleum oils and oils from bituminous minerals, not containing biodiesel, not crude, not waste oils; preparations n.e.c, containing by weight 70% or more of petroleum oils or oils from bituminous minerals; light oils and preparations HS 271012 and Petroleum oils and oils from bituminous minerals, not containing biodiesel, not crude, not waste oils; preparations n.e.c, containing by weight 70% or more of petroleum oils or oils from bituminous minerals; not light oils and preparations HS 271019 and they took average 67% in imports from Bulgaria. In 2014 a sharp increase in imports was related to light distillates and oil products. All other categories that have 1 per cent share in imports, as well as smaller and fragmentary categories are comprised of either primary consumer goods or intermediate products to produce goods and services. For example, in total imports from Bulgaria the share of intermediate gambling industry products increased from 0,5% in 2010 to 6,5% in 2016. There was a slight increase in the imports of winery, juice and other drink components up to 2.7%, which was inconsiderable in the previous years.
Wine is represented in the export of both countries. Although they differ in their revealed comparative advantage (Georgia with 15,2 and Bulgaria with 2.7 in 2006-2009) [Anderson &Nelgen, 2011], they also show some similarities. Georgia is more like Hungary and Bulgaria in having a small share of its wine production exported, rather than like Moldova and Macedonia, where export sales dominate domestic sales, except that it currently has a much higher average price for its exports [Anderson, pp. 10-11, 2013]. Bulgarian firms have got more long-term experience in the European and world markets, what could be combined with the efforts of the Georgian firms (in case of the interest of both parties) to expand the export of the Georgian wine.
Table 4
Georgia’sImport from Bulgaria according to the Largest Commodity Groups, 2010-2016 (Thousands of dollars)
|
Commodity Category |
2010 |
2011 |
2012 |
2013 |
2014 |
2015 |
2016 |
2017 (January-September) |
|
Petroleum oils and oils from bituminous minerals, not containing biodiesel, not crude, not waste oils; preparations n.e.c, containing by weight 70% or more of petroleum oils or oils from bituminous minerals; light oils and |
67,455.1 |
153,410.7 |
148,098.2 |
94,890.0 |
109,541.0 |
78,029.5 |
58,517.9 |
53,226.8 |
|
Petroleum oils and oils from bituminous minerals, not containing biodiesel, not crude, not waste oils; preparations n.e.c, containing by weight 70% or more of petroleum oils or oils from bituminous minerals; not light oils and preparations |
18,836.9 |
39,738.5 |
46,419.2 |
35,119.8 |
18,394.3 |
22,273.2 |
17,794.3 |
17,641.0 |
|
Medicaments; consisting of mixed or unmixed products; not containing antibiotics, hormones, alkaloids or their derivatives), for therapeutic or prophylactic uses, for therapeutic or prophylactic use, put up in measured doses (incl. those in the form of transdermal admin. systems) or packed for retail sale |
3,996.6 |
5,587.1 |
6,582.8 |
8,022.2 |
10,709.8 |
7,432.5 |
6,564.1 |
5,094.8 |
|
Games; operated by coins, banknotes, bank cards, tokens or by other means of payment, other than billiard articles and accesssories, and automatic bowling alley equipment |
611.1 |
554.1 |
549.2 |
1,173.9 |
5,736.6 |
9,002.9 |
9,748.6 |
4,100.7 |
|
Cigarettes; containing tobacco |
3,525.4 |
5,895.3 |
6,232.3 |
4,574.2 |
5,813.4 |
2,612.4 |
2,199.5 |
380.8 |
|
Cash registers |
0.1 |
10,218.8 |
2,793.0 |
1,964.1 |
1,388.1 |
1,851.6 |
1,202.3 |
1,187.2 |
|
Hair preparations; excluding shampoos and preparations; for permanent waving or straightening |
1,995.6 |
2,273.9 |
1,986.4 |
2,064.0 |
2,109.4 |
1,461.0 |
1,757.5 |
1,100.0 |
|
Presses, crushers and similar machinery; used in the manufacture of wine, cider, fruit juices or similar beverages |
2.5 |
4.2 |
202.6 |
2,005.7 |
3,266.9 |
2,009.6 |
1,097.2 |
3,348.6 |
|
Disodium carbonate |
- |
627.8 |
1,027.1 |
1,247.7 |
2,558.2 |
2,005.1 |
2,398.4 |
1,815.1 |
|
Washing and cleaning preparations; surface-active, whether or not containing soap including auxiliary washing preparations, not for retail sale |
651.5 |
1,123.3 |
1,079.8 |
1,129.3 |
1,665.0 |
2,200.9 |
1,606.8 |
1,395.5 |
Source: Data are obtained from the National Statistical Office of Georgia, http://www.geostat.ge/
From the Bulgarian side the picture is the following: Bulgaria is a larger trade partner for Georgia, than vice versa. Currently, Georgia takes 21th position among top export destinations of Bulgaria with the share of 0.94% in its total exports and 29th position among top import partners with the share of 0.64% in Bulgaria’s import.
Bilateral Investment relations between Georgia and Bulgaria
Bulgaria and Georgia are not major home countries of outgoing FDI given their level of economic development and their own need to attract capital to modernize their economies. Thus, one cannot expect large flows of FDI between them as they are mostly in the position of host countries for incoming investments. The two countries have created the necessary legal framework to promote bilateral investments. An Agreement on Mutual Promotion and Protection of Investments was signed in Sofia in January 1995 and came into force in August 1999. An Agreement for the avoidance of double taxation on income and property was signed in Tbilisi in November 1999 and came into force since 1st July 1999 [Convention between the Republic of Bulgaria and Georgia for the Avoidance of Double Taxation with respect to Taxes on Income and on Capital].
This treaty will facilitate investment flows between Georgia and Bulgaria, and hence the expansion of economic relations. In Georgia the Treaty covers the company profit tax, the property tax and the personal income tax, while in Bulgaria - the corporate income tax, the real property tax and the personal income tax.
Georgia has been very open to foreign investors and provides a very attractive business environment. According to the World Bank Ease of Doing Business ranking 2017 Georgia ranks 16th out of 190 analyzed countries around the world while Bulgaria occupies the 39th position.
According to the Bulgarian ambassador to Georgia the biggest Bulgarian investment in Georgia was made in 2008 by the company ‘Cable-Bulgaria’ which provided with fiber-optic cables for internet connection between Varna and Poti. The investment is assessed at 85 million US Dollars [Newcaucasus.com, 2017]. However, in the recent years the bilateral investment flows are meagre especially compared to major investors in Georgia coming from the neighboring countries like Azerbaijan, Turkey and Kazakhstan.
It is noteworthy that the statistical data on FDI flows obtained from different sources vary, what makes it difficult to draw adequate conclusions. However, cooperation agreement concluded between Georgian and Bulgarian state statistical services can be instrumental in improving the quality of data.
Table 5
FDI Flows between Georgia and Bulgaria, by Geographical Destination, (Millions of dollars)
|
|
Bulgarian FDI to Georgia |
Georgian FDI to Bulgaria |
|
2001 |
_ |
_ |
|
2002 |
_ |
_ |
|
2003 |
_ |
1 |
|
2004 |
_ |
-1 |
|
2005 |
_ |
_ |
|
2006 |
_ |
3 |
|
2007 |
1 |
-2 |
|
2008 |
_ |
10 |
|
2009 |
_ |
-4 |
|
2010 |
_ |
-5 |
|
2011 |
1 |
1 |
|
2012 |
2 |
_ |
Source: UNCTAD Bilateral FDI Statistics
According to the data of the Bulgarian National Bank, annual Bulgarian net FDI flows to Georgia amounted 0.1 million Euros in 2014, and 0.5 and 4.4 million Euros in 2015 and 2016 respectively. Georgian net FDI flows to Bulgaria amounted -0.1, 1.7 and 1.4 million Euros in 2014, 2015 and 2016 respectively. In 2016 Bulgaria has invested on net 320,2 million. € abroad out of which 4.4 million. € to Georgia. While this puts Georgia on the 15th position among the top destinations for Bulgarian investments it represents only 1.4% of the total Bulgarian FDI outflows. At the same time Georgia has invested just 1.4 million. € in Bulgaria in 2016.
It is interesting to note that the inward FDI stock by 2016 in Bulgaria sourced by Georgia is 23.4 million. €, while Bulgarian outward FDI stock to Georgia is just 12.7 million. € [BNB, 2017].
The Bulgarian-Georgian bilateral investments are in the energy sector (water-power plants), transportation, textile industry, food industry, pharmacy and cosmetics. There is a growing interest of common projects in the agriculture sector as well.
As shown by the table above, FDI flows from Bulgaria have come since 2001 (2 million US dollars); however, they are very fragmentary and they were negligible during 2002-2010. In the following years the share of Bulgaria in total FDI inflows in Georgia was less than 1%. Specifically, it was 0.2% in 2012, 0,3% in 2013, 0.5% in 2014, 0.5% in 2015, and 0,1% in 2016.
Bulgarian investors show interest in real estate, energy, transport and communications and financial sector. Among these sectors, real estate can be characterized as the most stable investment sector (relying on the data of three quarters in 2017 and the previous periods). It took 90,8% in 2012, 93,4 % in 2013, 67,2 in 2014, 66,8% in 2015 73,0% in 2016 of the total Bulgarian FDI in Georgia (see table 3).
Table 6
Bulgarian FDI in Georgia, 2010-2017 (Thousand of dollars)
|
Sector |
2010 |
2011 |
2012 |
2013 |
2014 |
2015 |
2016 |
I Q 2017 * |
II Q 2017 * |
|
Total |
-90.0 |
916.4 |
2,234.6 |
2,562.6 |
9,070.1 |
7,129.8 |
1,569.5 |
2,540.4 |
1,548.4 |
|
Including: |
|
|
|
|
|
|
|
|
|
|
Manufacturing |
- |
- |
- |
- |
- |
7.1 |
-6.3 |
-1.1 |
-0.3 |
|
Energy |
- |
- |
- |
-65.3 |
2,854.0 |
1,685.6 |
232.8 |
84.8 |
-5.0 |
|
Construction |
- |
- |
- |
- |
- |
517.6 |
- |
0.0 |
8.0 |
|
Transport and Communications |
-90.0 |
588.9 |
207.8 |
326.5 |
270.3 |
120.1 |
217.6 |
-2.0 |
-351.2 |
|
Including: |
|
|
|
|
|
|
|
|
|
|
Transport |
... |
... |
... |
... |
... |
120.1 |
217.6 |
-2.0 |
-351.2 |
|
Real Estate1 |
- |
-94.8 |
2,028.5 |
2,393.1 |
6,091.0 |
4,762.9 |
1,146.4 |
2,453.4 |
1,972.7 |
|
Healthcare and Social Protection |
- |
- |
- |
- |
- |
- |
- |
4.7 |
3.0 |
|
Financial Sector2 |
- |
422.3 |
-3.1 |
62.0 |
-37.1 |
16.9 |
80.9 |
4.0 |
-74.9 |
|
Other remaining sectors3 |
- |
- |
1.4 |
-153.7 |
-108.2 |
19.6 |
-101.8 |
-3.4 |
-4.0 |
Source:
1. National Statistics Service of Georgia (Statistical Report on “Foreign Economic Activty”);
2. National Bank of Georgia;
3. Ministry of Education and Sustainable Development of Georgia; 4. Ministry of Finance and Economy of the Autonomous Republic of Adjara.
2.Since 2009 Financial sector data have been including FDI in banking, microfinance and insurance organization
1.Real estate operations, renting and consumer
3.Trade, education, housing, social and personal services
*Preliminary data
Trade in Services and Tourism
Tourism represents a sector with great potential for the intensification of the bilateral foreign economic relations of Georgia and Bulgaria. A stimulating role is yet to play the recent liberalization of the visa regime for Georgian citizens coming for a short stay to the EU. 11 355 Georgians visited Bulgaria in 2016 – that is an increase by 8.4% in comparison with the previous year and puts Georgia on the 45th position among the major tourist markets for Bulgaria. In the reverse direction not so many Bulgarians have yet discovered Georgia as an attractive tourist destination – in 2015 only 1 563 tourists visited it.
Table 7
Tourism between Bulgaria and Georgia (number of tourists)
|
|
2007 |
2008 |
2009 |
2010 |
2011 |
2012 |
2013 |
2014 |
2015 |
2016 |
|
Georgian tourists in Bulgaria |
5 004 |
4 983 |
3 520 |
4 147 |
4 916 |
7 978 |
11 131 |
10 269 |
10 476 |
11 355 |
|
Bulgarian tourists in Georgia |
2 221 |
1 616 |
1 832 |
1 688 |
1 445 |
673 |
730 |
537 |
1 563 |
n.a. |
Source: Bulgarian Ministry of Tourism
Deepening the bilateral ties in the tourism sector would require focused promotional campaigns supported by both states. Furthermore, there is a need of introducing direct regular flights and extension of the system of charter flights between Georgia and Bulgaria. The low-cost air company Wizz air has been operating for a very short period of time a direct airline between Sofia and Kutaisi before closing it due to low occupation rates.
The geographical location on both sides of the Black sea makes it possible to develop common cruise routes including the ports of Varna, Burgas, Batumi, etc.
Not only the Black sea and the ski resorts of both countries could attract tourists on a mass basis, there is a huge potential in the alternative forms of tourism such as exploring each other’s traditional cuisine and wine, and the cultural and historical heritage. For example, a very prominent place of interest for Georgian tourists is Bachkovo monastery - the second biggest monastery in Bulgaria which was founded by two Georgian brothers in the XI century.
Bulgaria takes the 18th position among the largest partners of Georgia by the number of visitors. In Georgia there are a number of difficulties with collecting data of trade in services, including tourism export and imports. For example, data on tourism service import from Bulgaria and the number of Bulgarian visitors can be obtained from only border crossing statistics (table 8). In addition to it, divergence between the data collected from national and international statistical sources create some research obstacles, that is obvious from the numbers given on table 7 and table 8. They show that the number of Georgian visitors in Bulgaria exceeds the total number of visitors in 2015. As mentioned above, Georgian and Bulgarian governments hold an agreement on cooperation in the field of statistics, which has been in force since September 8, 1998 [The National Statistics Office of Georgia]. More active cooperation in this area can fill the data gap and improve the quality of trade in services data.
Table 8
Bulgarian Visitors in Georgia (the number and the share in total, 2013-2017)
|
Years |
Number of visitors |
Share in total number of visitors, % |
|
2013 |
649 |
0.0120 |
|
2014 |
540 |
0.0098 |
|
2015 |
588 |
0.0100 |
|
2016 |
495 |
0.0077 |
|
2017 (January) |
654 |
0.1689 |
Source: Information and Analytical Department of the Ministry of Internal Affairs of Georgia, Information Centre, 2017
The majority of the population in both countries are orthodox Christians _ 83,4% in Georgia (By 2004 census data) and 59,4% (by 2011 census data). Therefore, these countries have a big potential for the development of religious tourism. A good opportunity for funding of common projects in the tourism sector presents the Black Sea Basin Program 2014-2020 - part of EU’s Cross-Border Cooperation under its European Neighborhood Instrument. Over 25.3 million. € are allocated for promotion of business and entrepreneurship in the tourism and cultural sectors. The maximum grant for a project can reach 1.5 million. €, while the minimum is 0.3 million €.
Bilateral Money Transfers
For the last decade remittances transferred by Georgian emigrants via formal channels have been increasing. Money transfers from Georgia to foreign countries also has shown a stable upward trend. The latter increased from 46.4 million US dollars in 2004 to 178 million dollars in 2014. [Migration Profile of Georgia, pp. 50-51, 2015].
Table 9
Money Transfers betweeen Georgia and Bulgaria, 2010-2017 (Thousand US dollars)
|
2010 |
2011 |
2012 |
2013 |
2014 |
2015 |
2016 |
2017 (January-Setember) |
||||||||
|
Inflow |
Outflow |
Inflow |
Outflow |
Inflow |
Outflow |
Inflow |
Outflow |
Inflow |
Outflow |
Inflow |
Outflow |
Inflow |
Outflow |
Inflow |
Outflow |
|
247.1 |
373.3 |
503.8 |
331.2 |
336.2 |
401.4 |
348.7 |
642.3 |
348.7 |
451.0 |
404.4 |
218.3 |
381.9 |
318.0 |
398.2 |
309.0 |
Source: Authors’ calculations based on the data of the Naional Bank of Georgia
Despite the above, Bulgaria is not among the top partners of Georgia by the inward and outward flows of remittances. Remittance movement in both directions are relatively small. As shown by the table above, the largest amount out-flowed from Georgia to Bulgaria was in 2013 (642.3 thousand US dollars) and the largest amount in-flowed from Bulgaria was in 2011 (503.8 thousand US dollars).
Transport and Energy Cooperation
The geographical location of Bulgaria and Georgia on the Transport Corridor Europe-Caucus-Asia (TRASECA) presupposes intensive relations in the transport sector.
It is noteworthy that in their development strategies both countries see their role in the realization of the corridor connecting Europe and Asia. For the Asian countries DCFTA opens path to the EU market of 500 million people. In its turn, Bulgaria regards itself the link between the EU and its Eastern neighbors, including Georgia [Transport and Logistics in Bulgaria, p. 56, 2007-13]. According to the Logistics Performance Index (measured by the World Bank) presented on table 10, Georgia is much behind Bulgaria. Both countries need a number of steps to improve their logistic competitiveness and realize the functions of connecting the Europe and Asia.
Table 10
Development of Transport and Logistics in Georgia and Bulgaria, 2010-2016
|
Year |
|||||||||
|
Bulgaria |
2010 |
63 |
2.83 |
2.50 |
2.30 |
3.07 |
2.85 |
2.96 |
3.18 |
|
2012 |
36 |
3.21 |
2.97 |
3.20 |
3.25 |
3.10 |
3.16 |
3.56 |
|
|
2014 |
47 |
3.16 |
2.75 |
2.94 |
3.31 |
3.00 |
2.88 |
4.04 |
|
|
2016 |
72 |
2.81 |
2.40 |
2.35 |
2.93 |
3.06 |
2.72 |
3.31 |
|
|
Georgia |
2010 |
93 |
2.61 |
2.37 |
2.17 |
2.73 |
2.57 |
2.67 |
3.08 |
|
2012 |
77 |
2.77 |
2.90 |
2.85 |
2.68 |
2.78 |
2.59 |
2.86 |
|
|
2014 |
116 |
2.51 |
2.21 |
2.42 |
2.32 |
2.44 |
2.59 |
3.09 |
|
|
2016 |
130 |
2.35 |
2.26 |
2.17 |
2.35 |
2.08 |
2.44 |
2.80 |
Source: Logistics Performance Index, https://lpi.worldbank.org/international/global/2016
There is a regular ferry line Varna – Batumi/Poti – Varna which provides a "door to door" carriage of all types of cargo (railway rolling stock, trucks, and containers, passengers, deck cargo and cars). In 2014 a Ro-Ro connection Burgas – Novorossiysk – Poti was restored after its suspension in 2010. The ferry “Druzhba” is the biggest Ro-Ro/passenger ship in the Black sea that can carry over 200 containers, 110 large trucks, 90 cars and about 400 passengers. The two ferry connections have special importance as the Black Sea ports of both countries can become part of the New Silk Road from China to Europe.
In 2016 the Memorandum of Understanding between the Bulgarian State Railways and Trans-Caucasian terminals was signed making possible the development of transports via the Varna-Ilyichevsk-Poti/Batumi railway-ferry connection. The expectations are for attracting new cargoes and the possible accession of the Bulgarian freight railway carrier to the “Silk train” - a container train linking the Georgian port of Poti with Baku carrying goods from China to Europe through the Trans-Caucasian route. Recently, a train composition starting from Urumqi in western China made it to Poti in just seven days, manifesting the potential of the Belt and Road Initiative.
Furthermore, Georgia is an important partner of the EU in the implementation of projects to diversify energy sources and routes to deliver natural gas to Europe, including Bulgaria. Georgia has expressed vivid interest in participating in various transnational infrastructure projects, from the Southern Gas Corridor with Azerbaijan and Turkey to the development of a new multimodal transport corridor Bulgaria - Black Sea - Georgia - Azerbaijan / Armenia – Iran, thus playing a crucial role in the ambition of Bulgaria to become a gas hub. Since July 2017 Georgia is a member of the Energy Community – an international organization created by the EU that extends the EU internal energy market and governance outside EU borders. It creates a concentric circle closest to the integrated energy market that allows for cross border trading, including building new infrastructure with partners.
Bulgaria and Georgia have the historic chance to benefit from both EU and China supported initiatives in the field of energy and transportation cooperation.
Findings, conclusions and recommendations
Georgia and Bulgaria have opportunities to deepen economic cooperation in a number of directions, such as trade in goods, tourism, investments, transport and energy, etc. Bulgaria is an important trade partner of Georgia by both export and import flows. It took around 4-10% of total Georgian export in 2010-2016. The main export categories are traditional and simple products. Minerals and raw materials take the largest share in exports. Bulgaria takes approximately 2,76 % of Georgia’s total imports. Import from Bulgaria is dominated by fuels and primary consumer goods. The main import product category is petroleum oil and oil products, which has taken 67% on average since 2010. All other commodity groups are represented either in a smaller amount or are rather fragmentary.
The conclusion drawn from the analysis of the bilateral export and import patterns is that the economic cooperation potential between Georgia and Bulgaria is not fully realized. In our view the exporting potential needs to be further explored, in order to reveal the opportunities of participation in the global export and value chains. Trade in tourism service between Georgia and Bulgaria is scarcely represented. However, Black Sea Resorts enable the two countries to develop joint cruises. A big share of the orthodox Christians in their population creates opportunities for the development of bilateral religious tours. It is noteworthy that one of the largest religious destinations in Bulgaria – Bachkovo Monastery was founded by the Georgians in the 11th century. One of the impediments is the high air fare and the abolition of cheap flights from Kutaisi to Sofia. If there is demand, they will be probably renewed. The analysis of the bilateral FDI flows between Georgia and Bulgaria shows that the scope of interest of the Bulgarian investors involves a limited number of sectors, which does not significantly affect the economic growth of the country. The potential of bilateral investment activities is also under-realized.
The appropriate recommendations could be:
- joint efforts made by public authorities and businesses and the academic circles to identify obstacles and limitations in bilateral economic relations;
- improvement of information accessibility on various economic aspects of bilateral cooperation and dissemination via Ministries and the embassies.
In our view joint efforts of the government, private sector and the academia should be made to develop interpersonal communication networks and to increase mutual awareness between the two countries and that will promote trade and investment activities. These steps could involve: on the part of the government organization of the exhibitions, adequate use of the information spaces, active engagement of the economic units of the Embassies, etc; on the part of the private sector- joint tour initiatives, on the part of the academic circles-; joint research into the potential areas of bilateral cooperation, participation in exchange programs not only to share experience, but also to “discover” different culture and expand communication, what in its turn could lay grounds for new businesses. These steps could promote efficient policy decisions at the macro level, while at the micro level help to improve the performance of the existing and the potential firms in the market and, hence, ensure deeper and stronger bilateral economic ties.
References
Anderson, K., (2013), Is Georgia the Next “New” Wine-Exporting Country? Journal of Wine Economics, Volume 8, Number 1.
Anderson, K. & Nelgen, S. (2011). Global Wine Markets, 1961 to 2009: A Statistical Compendium. Adelaide: University of Adelaide Press, accessibleasane-bookat, available at: www.adelaide.edu.au/press/titles/global-ineandasExcelspreadsheetsatwww.adelaide.edu.au/wineecon/
databases/GWM/.
Association Agenda (2017), EU-Georgia Association Agenda is in force, Information of Ministry of Foregin Affairs of Georgia, http://www.mfa.gov.ge/News/saqartvelo-evrokavshiris-asocirebis-akhali-dgis-ce.aspx?CatID=5 (Seen in November, 2017).
BNB (2017), Bulgarian National Bank, http://bnb.bg (Seen in November, 2017).
Bruce-Lockhart, A., (2017) China’s $900 billion New Silk Road. What you need to know, World Economic Forum, https://www.weforum.org/agenda/2017/06/china-new-silk-road-explainer/ (Seen in November, 2017).
Convention between the Republic of Bulgaria and Georgia for the Avoidance of Double Taxation with respect to Taxes on Income and on Capital, Ministry of Finance of Georgia, International Taxation
http://mof.ge/en/4681 (Seen in November, 2017).
Eastern Partnership (2017), Eastern Partnership - 20 Deliverables for 2020 Focusing on key priorities and tangible results, JOINT STAFF WORKING DOCUMENT, EUROPEAN COMMISSION, Brussels, 9.6.2017 SWD(2017) 300 final, https://eeas.europa.eu/sites/eeas/files/swd_2017_300_f1_joint_staff_working_paper_en_v5_p1_940530.pdf (Seen in November, 2017).
European Union External Action (2017), EU-Georgia relations - factsheet, https://eeas.europa.eu/headquarters/headquarters-homepage_en/23634/EU-Georgia%20relations,%20factsheet (Seen in November, 2017).
Grigalashvili M., What Georgia, Moldova, and Ukraine Want From the Brussels Summit, Georgian Intitute of Politics, 2017, http://gip.ge/wp-content/uploads/2017/09/Commentary17.pdf (Seen in November, 2017).
Information and Analytical Department of the Ministry of Internal Affairs of Georgia, Information Centre, 2017.
LPI Global Rankings, https://lpi.worldbank.org/international/global/2010/2012/2014/2016.
Migration Profile of Georgia (2015), Government Commission on Migration Issues, 2015.
Ministry of Economy and Sustainable Development of Georgia. http://www.economy.ge/?page=ecoreview&s=20.
Ministry of Finance and Economy of the Autonomous Republic of Adjara http://adjara.gov.ge/branches/default.aspx?gid=5.
Ministry of Foreign Affairs of Georgia, http://www.mfa.gov.ge
National Bank of Georgia, https://www.nbg.gov.ge/index.php?m=304 (Seen in November, 2017)
National Statistics Office of Georgia, http://www.geostat.ge/
Newcaucasus.com (2017), Desislava Ivanova: Bulgaria – a Strong Supporter of the European and Euro-Atlantic Prospects of Georgia, interview available at: http://newcaucasus.com/in-english/16203-desislava-ivanova-bulgaria-a-strong-supporter-of-the-european-and-euro-atlantic-prospects-of-georgia.html (Seen in November, 2017).
Transport and Logistics in Bulgaria (2007-13), Transport and Logistics in Bulgaria, Project “Promoting the advantages of investing in Bulgaria”, Invest in Bulgaria, 2007-13.
UNCTAD Bilateral FDI Statistics, http://unctad.org/en/Pages/DIAE/FDI%20Statistics/FDI-Statistics-Bilateral.aspx (Seen in November, 2017).
World Development Indicators, 2016, https://data.worldbank.org/data-catalog/world-development-indicators (Seen in November, 2017).